It’s often possible to generate significantly more insights for decision-making from readily available data. Typically, this involves parsing, cleaning, restructuring, and combining different data sets. This provides a reality check to test assumpations and may well reveal overlooked trends and patterns. It also provides a basis for clearer reporting and increased transparency.
Key to this are:
- Uncovering potentially useful data
- Applying appropriate tools and techniques to reveal overlooked patterns and trends
- Presenting insights in a compelling and easily digestible way
Geospatial analysis
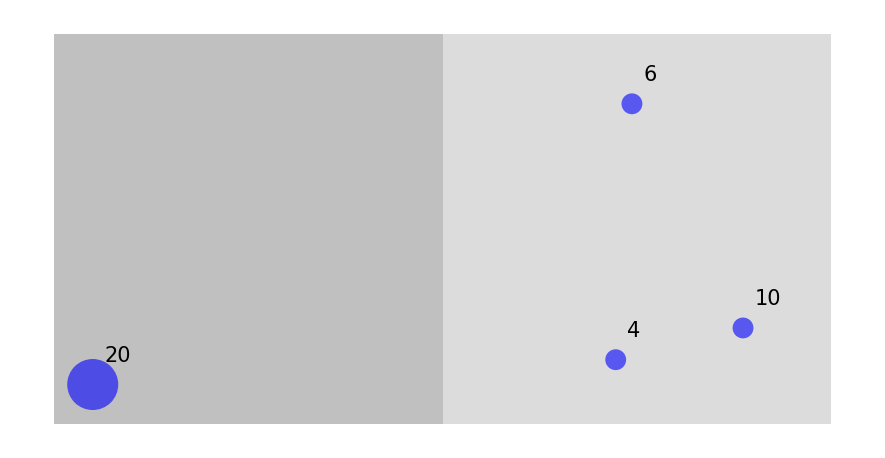
The figure below represents funding for partnerships between organisations in two adjacent regions.
The analysis used readily available project data to reveal patterns in the distribution of funding, which raised questions about the project’s theory of change.
The same number of organisations are involved in each of the two regions (shown by the numbers next to the markers), but all the organisations in the western region are in one location far from the eastern region. Moreover, the aggregate funding for organisations in the western region (inidcated by the size of the markers) is significantly higher than for organisations in the eastern region.